


Running a dealership without tracking the right data is like driving without a dashboard. You can move, but you can’t tell how fast, how far, or when something is about to break.
Car dealership analytics gives you that dashboard. It turns the data your dealership already generates into decisions, on inventory, pricing, staffing, and customer retention. This is what data analytics for car dealers looks like in practice.
Key Takeaways
- Car dealership analytics connects data from sales, inventory, service, and marketing into a single view of business performance
- The KPIs that affect gross most directly are closing ratio, gross profit per vehicle, days supply, and service absorption rate
- Predictive analytics in the automotive industry uses historical data to forecast inventory demand, pricing, service lane volume, and customer trade-in timing
- A dealership analytics platform sits on top of the DMS and turns raw transactional data into real-time performance dashboards
- Small and large dealerships both benefit from analytics — the difference is how quickly a smaller team can act on the insights
What Is Car Dealership Analytics?
Car dealership analytics is the systematic process of collecting, processing, and analyzing the massive amounts of data generated across all operational departments of an automotive retail business. This includes everything from initial customer contact and sales closings to service bay efficiency and parts inventory.
Essentially, it transforms raw dealership data, the numbers behind every transaction, service appointment, and marketing click, into actionable intelligence. This holistic view, often referred to as auto dealership analytics, allows management to move past relying on ‘gut instinct’ and use quantifiable facts to guide high-stakes decisions.
Benefits of Car Dealership Analytics
Data analytics for car dealers touches every part of the business. These are the areas where dealerships see the most direct impact.

1. Smarter Inventory Decisions
Dealers who track inventory data know which models move fast and which ones sit. Car dealership analytics pulls historical sales patterns and local demand signals together so you can stock the right vehicles at the right time. Dealerships with average inventory of 60 days or less have a 15% higher profit margin, per Fiserv. (Source: World Metrics)
2. Targeted Marketing
Most dealership marketing budgets are spread across channels without a clear picture of what is actually working. Automotive marketing analytics identifies which sources produce buyers, not just leads, so spend goes where it generates returns.
3. Better Customer Retention
Data analytics for car dealers tracks customer behavior across the entire ownership cycle. When a customer is due for a service, approaching a trade-in window, or showing signs of shopping elsewhere, the data surfaces it before the opportunity is gone. Dealerships with this level of tracking have artificial intelligence development services integrated into their data stack.
4. Improved Service Performance
Service departments generate consistent revenue but the numbers behind them are rarely tracked in detail. Analytics gives service managers a clear view of technician utilization, appointment patterns, and which repair categories drive the most gross. That visibility alone changes how the department is managed.
5. Faster, More Confident Decisions
When reporting runs on spreadsheets and manual pulls, managers spend time gathering data instead of acting on it. Dealership analytics and reporting tools put current performance numbers in front of the right people so the business responds faster to what is actually happening.
Key KPIs Every Car Dealer Should Track
Car dealer analytics is only as useful as the metrics behind it. These are the numbers that directly affect profitability and where most dealerships have blind spots.
Sales
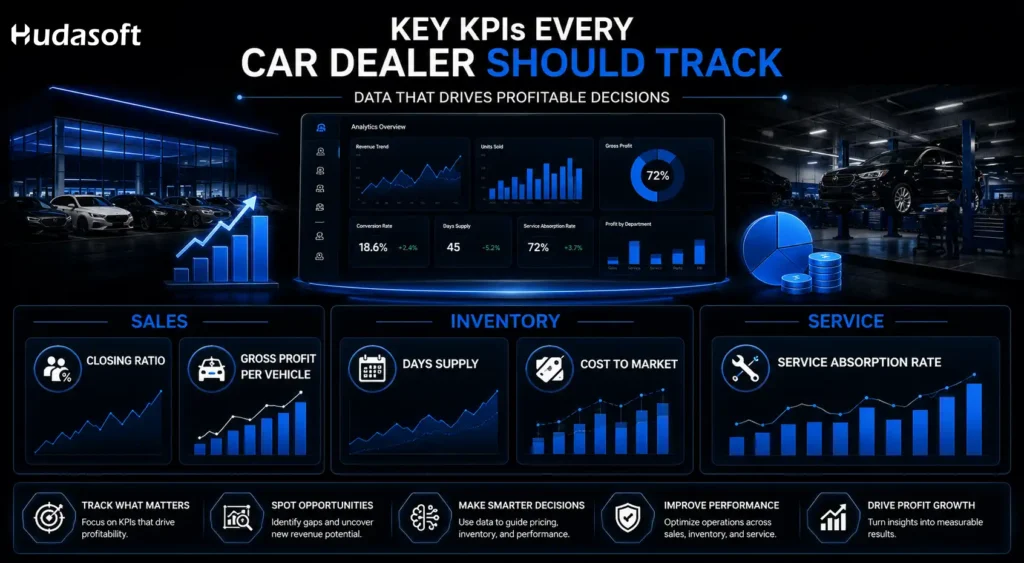
Closing ratio is the percentage of leads that result in a sale. The industry average sits around 20%. If yours is below that, dealer performance analytics will show whether the problem is lead quality, follow-up speed, or what happens on the lot.
Gross profit per vehicle, both front-end and back-end, gives a more honest picture than total units sold. A store moving more cars at thin margins can easily underperform a smaller competitor with stronger F&I penetration.
Inventory
Days supply tracks how long your current stock would last at your current sales pace. Monitoring days supply by model lets you catch slow movers before carrying costs eat into the margin. This is where dealership analytics and reporting tools pay for themselves quickly.
Cost to market shows where each vehicle sits relative to local competition. Without tracking this, pricing decisions are based on assumption.
Service
Service absorption rate measures how much of your total operating expenses are covered by service and parts revenue. A well-run store targets 70% or above. Automotive sales performance analytics that ignore fixed ops are only telling half the story.
Predictive Analytics in the Automotive Industry
Most dealership decisions are made looking backward. Last month’s sales report, last quarter’s inventory data, last year’s service numbers. Predictive analytics in the automotive industry changes that by using historical data to forecast what is coming so dealers can act before the opportunity passes.
Inventory Demand Forecasting
Knowing which models will sell in the next 60 to 90 days is worth more than knowing which ones sold last quarter. Vehicle data analytics for dealerships pulls sales history, seasonal patterns, and regional demand signals together to forecast what buyers in your market will be looking for.
Dealers who act on that forecast buy better at auction, negotiate better with OEMs, and carry less dead stock.
Vehicle Data Analytics for Pricing
Pricing a used vehicle correctly on day one is one of the most profitable decisions a dealer makes. Most stores price based on what they paid and what feels right.
Vehicle data analytics dealership pricing tools compare your stock against live local market data, days on lot benchmarks, and demand curves for that specific trim level. Market analysis for car dealerships at this level of detail removes the guesswork from pricing entirely.
The result is a price that moves the unit faster without leaving gross on the table.
Service Lane Forecasting
Appointment volume in the service lane is predictable when you have the right data. Car dealer analytics applied to service history, vehicle age profiles, and seasonal maintenance patterns can forecast demand by day and week with reasonable accuracy.
Service managers who have that visibility staff appropriately, reduce wait times, and keep technician utilization high.
Customer Behavior and Trade-in Timing
Predictive models built on ownership data can identify when a customer in your database is likely to be in the market again. Vehicle age, mileage milestones, equity position, and local market conditions all feed into the model.
A dealer who reaches out at the right moment closes at a higher rate than one running a blanket campaign to the same list. Automotive sales performance analytics makes that timing visible.
Integrating Analytics with the Dealership Management System (DMS)
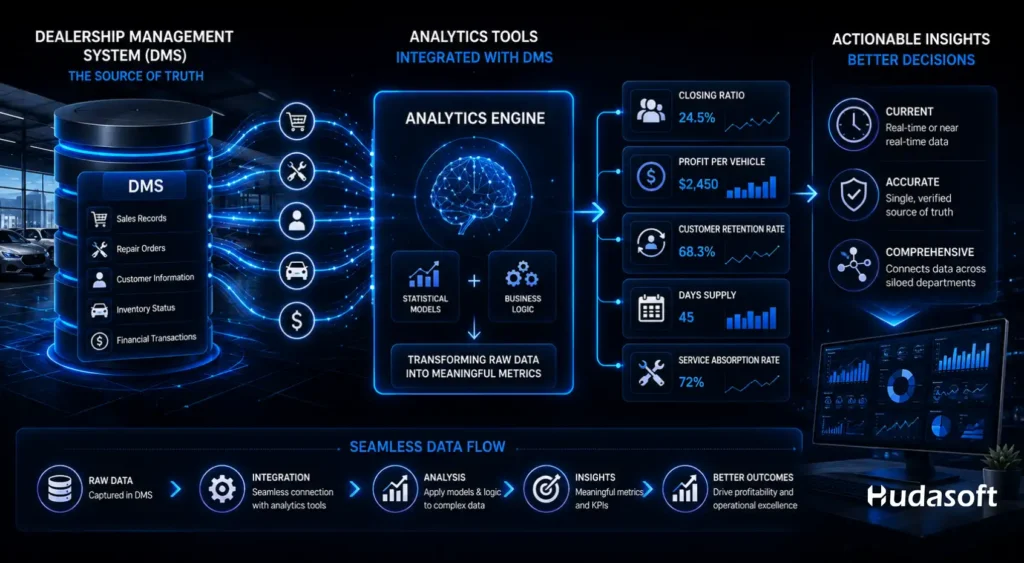
The core source of this data is the Dealership Management System (DMS), which serves as the operational backbone of the business. The DMS holds the raw, transactional data sales records, repair orders, customer information, inventory status, and financial transactions.
Analytics tools integrate directly with this DMS. They don’t just pull raw numbers; they take that complex data and apply statistical models and business logic to transform it into meaningful metrics (like closing ratios, profit per vehicle, and customer retention rates). This integration is crucial because it ensures the data is:
- Current: Decisions are based on real-time or near-real-time data.
- Accurate: The analysis uses the single, verified source of truth from the DMS.
- Comprehensive: It links data from different siloed departments (e.g., connecting a service visit to a future sales opportunity).
This seamless flow of information is what enables a dealer to move beyond basic reporting toward sophisticated capabilities like predictive analytics in the automotive industry, the foundation of auto dealership digital transformation that most dealer groups are executing right now.
Role of Dealership Management Software (DMS) in Analytics
The core source of this data is the Dealership Management System (DMS), which serves as the central system of the business. The DMS holds raw transactional data including sales records, repair orders, customer information, inventory status, and financial transactions.
A vehicle data analytics solution for car dealers integrates directly with the DMS and applies statistical models and business logic to transform that data into meaningful metrics like closing ratios, profit per vehicle, and customer retention rates.
This integration is essential because it ensures all analysis is based on a single, verified source of truth, allowing dealers to move from basic historical reporting to powerful predictive insights.
Case Example: IBIZI — Dealership Analytics in Practice
IBIZI is a dealership management platform built by Hudasoft. Here is how auto dealer analytics worked in practice for the dealerships that adopted it.
The Challenge
Dealerships using legacy systems were managing scattered communication, manual deal entry, and no centralized view of the business. Management had no real-time performance data to work with. Decisions were based on instinct because the numbers simply were not available in one place.
The Solution
IBIZI was built with deep API integrations across CDK Global and VinSolutions, connecting sales, service, and inventory data into a single platform. It eliminated manual deal entry, centralized customer records, and gave management real-time visibility across all departments.
Auto dealership analytics and reporting was applied directly on top of that centralized data, replacing instinct-based decisions with current, accurate performance numbers.
The Results:
The shift to a data-driven model delivered immediate, measurable impact:
| Metric | Outcome | Core Analytic Principle |
| Deal Entry Time | 70% Faster | Streamlined process metrics. |
| Service Lead Time | 30% Reduction | Operational efficiency analysis. |
| Inventory Visibility | 3x Increase | Real-time car dealership analytics for stock control. |
| Customer Satisfaction | 25% Improvement | Automotive marketing analytics via feedback loops and engagement portals. |
The 70% reduction in deal entry time directly improved closing ratio by freeing salespeople from paperwork. The 3x increase in inventory visibility gave management a current view of stock, which is where analytics for car dealers pays off most directly in day to day operations.
Conclusion: Using Data to Win
Car dealership analytics is not a single tool or a one-time project. It is a way of running the business where decisions on inventory, pricing, service, and customer outreach are backed by current, accurate data rather than experience alone.
The KPIs covered in this post, the predictive models, and the DMS integration layer all work together. None of them delivers much in isolation. But when they connect, the visibility they create changes how a dealership operates at every level. That operational discipline is what car dealership best practices are built around.
The dealers gaining ground on their competitors right now are not necessarily bigger or better funded. They are simply working with better information.
Frequently Asked Questions
How can I use data insights to boost profitability in my car dealership?
Start with the metrics that directly affect gross. Track closing ratio by salesperson, gross profit per vehicle on both front and back end, and days supply by model.
These three alone will surface where the dealership is losing money. Once those are visible, layer in service absorption rate and cost to market on used vehicles.
Most dealers who do this find at least one area where the numbers tell a story that gut feel was missing entirely.
What is the difference between a DMS and a dealership analytics platform?
A DMS records what happens in your dealership. Every transaction, service order, inventory movement, and customer record goes in.
A dealership analytics platform sits on top of that data and turns it into performance dashboards, KPI tracking, and forecasting models. The DMS is the source of truth. The analytics platform is what makes that data readable and useful for decision making.
What should I look for in a dealership analytics platform?
The most important factor is whether it connects to your existing systems without manual data entry. A platform that requires your team to input data separately from the DMS will not get used consistently.
Beyond that, look for real time reporting, role based access so managers see what is relevant to their department, and the ability to track KPIs at both the dealership and individual level. Hudasoft’s dealership management solution covers all of these within a single integrated platform.
How long does it take to see results from dealership analytics?
It depends on how quickly the platform integrates with your existing systems and how consistently the team uses it. Most dealerships see meaningful visibility into performance within the first 30 days.
Actual improvements in metrics like closing ratio, days supply, and service utilization typically show within 60 to 90 days once the team starts making decisions based on the data rather than habit.
Can small dealerships benefit from analytics or is it only for large groups?
Single-point dealerships often benefit more quickly than large groups because the data is less complex and the team can act on insights faster.
The KPIs that matter most, closing ratio, gross per vehicle, days supply, and service absorption, are just as relevant at a 50-unit-a-month store as they are at a 500-unit operation. The difference is that a smaller store has fewer layers between the data and the decision maker.
How much does dealership analytics software cost?
The cost varies based on several factors. Single-point dealerships will pay less than multi-rooftop groups.
A standalone analytics layer sitting on top of an existing DMS costs less than a fully integrated platform that replaces the DMS entirely. Custom integrations with systems like CDK Global or VinSolutions affect pricing as well.

