

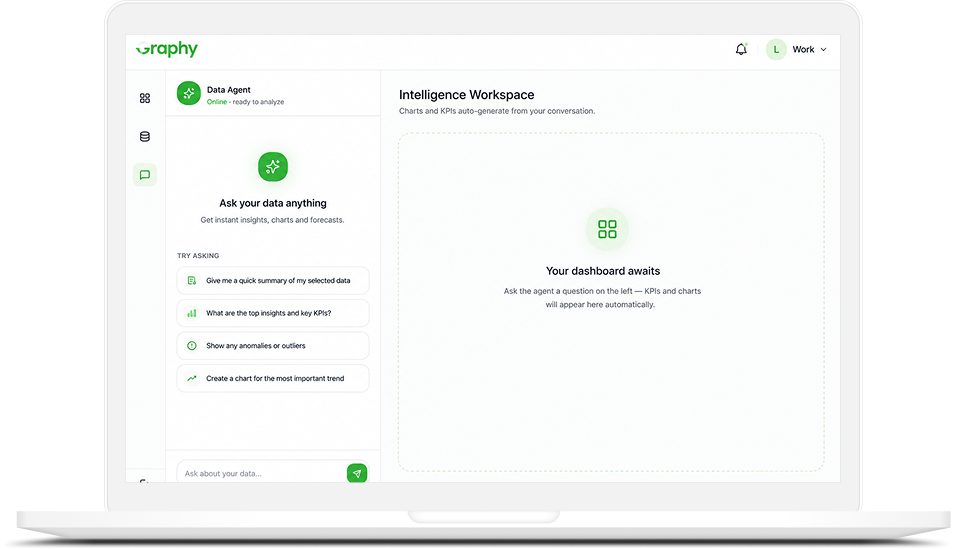


















Ask business questions in natural language and receive AI-generated dashboards instantly. No SQL. No spreadsheets. No technical expertise required.

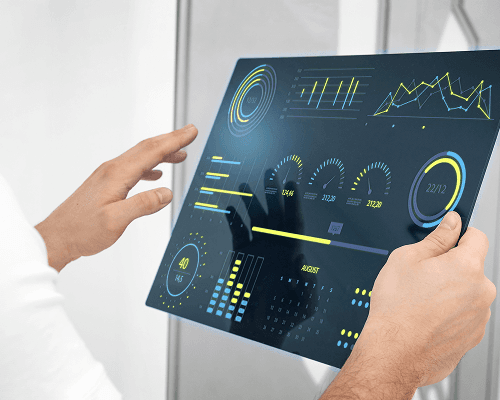
Monitor sales, finance, operations, HR, marketing, customer experience, and business KPIs from one centralized dashboard.
Forecast sales, revenue, inventory, customer demand, and operational performance using machine learning.

Automatically detect unusual business activity, revenue fluctuations, KPI deviations, and operational risks.

Generate executive reports automatically for leadership teams and stakeholders.

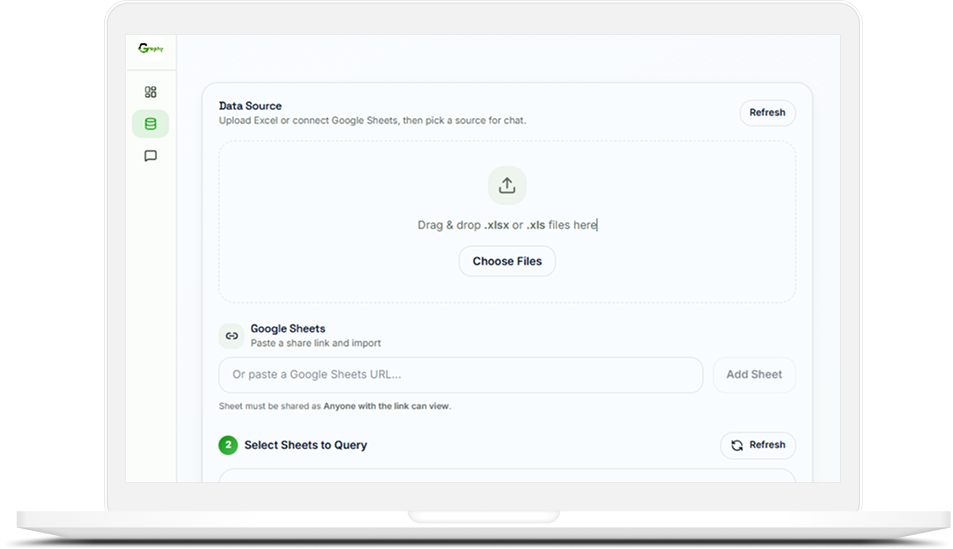
Connect with ERP Systems, CRM Platforms, Accounting Software, SQL Databases, Excel, Google Sheets, HR Systems, REST APIs, Cloud Platforms, and Custom Business Applications.

Graphy analyzes trends and recommends actions that improve business performance – revenue optimization, sales opportunities, inventory planning, cost reduction, resource optimization, customer retention, and operational improvements.

Enterprise-grade authentication, encryption, audit logging, and role-based access controls ensure business data remains secure.